

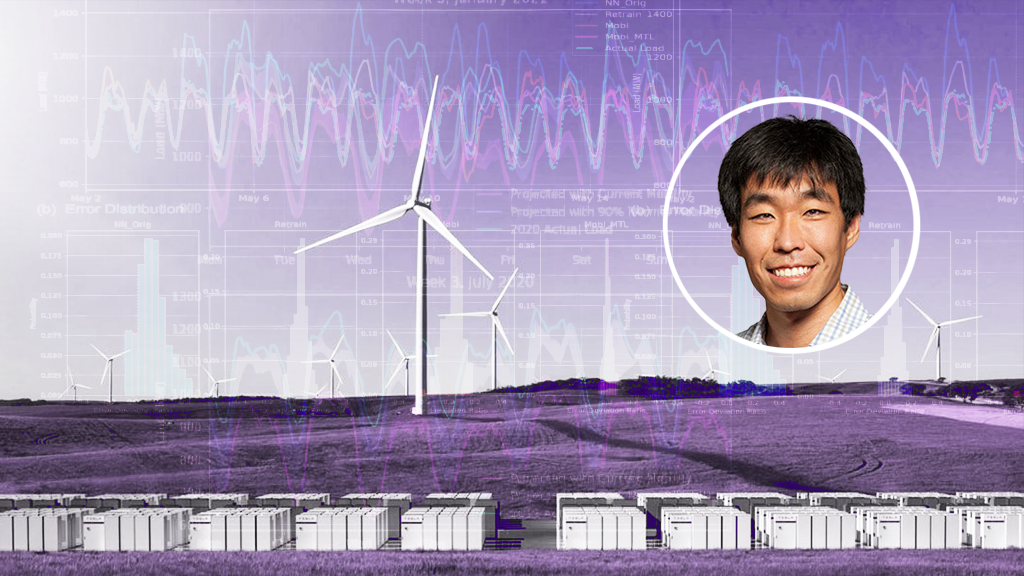
UW ECE Keith and Nancy Rattie Endowed Career Development Professor
Baosen Zhang. Photo illustration by Ryan Hoover
In a paper published on the preprint server Arxiv.org, researchers at Microsoft and the University of Washington, including Keith and Nancy Rattie Endowed Career Development Professor Baosen Zhang, propose an AI system that uses smartphone location data to forecast electrical load. They say their architecture, which takes into account data from geographical regions both within the U.S. and Europe, can outperform conventional forecasting methods by more than three times.
The pandemic shows no sign of abating, and it’s made a striking impact on the global electrical grid. Stay-at-home orders and social distancing meant to slow the outbreak of COVID-19 have resulted in major shifts in load patterns and peak demands. Italy saw a 25% reduction in demand during its country-wide lockdown, and in the U.S., overall power consumption has fallen to a 16-year low.
Typical power forecasting algorithms consider weather, timing information, and previous consumption levels in their predictions, but the paper’s coauthors claim those techniques can’t capture the large and sudden shifts caused by the pandemic. That’s because they take for granted that similar days at similar times of the year observe similar load patterns, an assumption the crisis fundamentally changes — there aren’t any historically similar events.
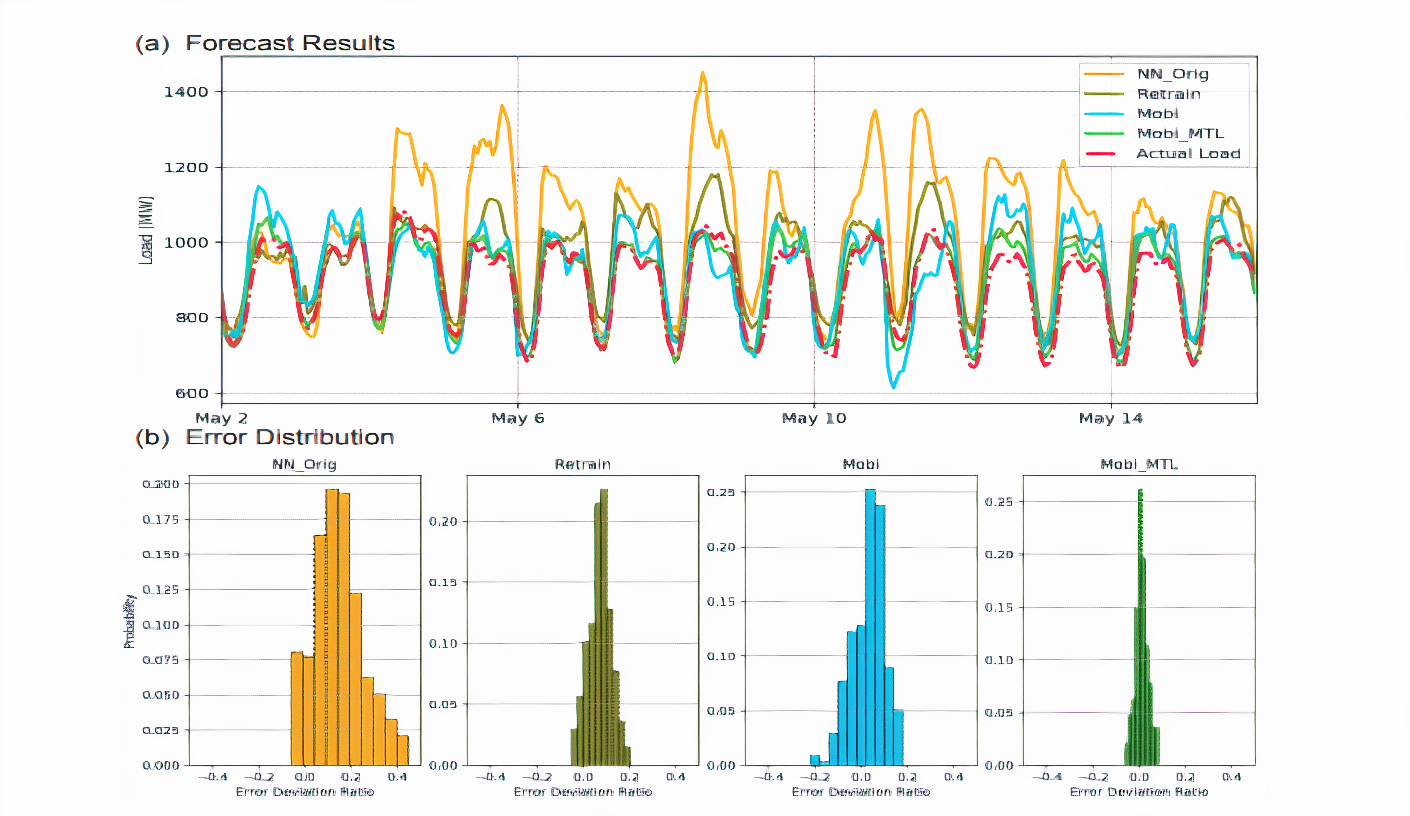
Above: Load forecast results on Seattle City Light data set. Mobi_MTL is the best-performing of the researchers’ AI models.
In the proposed model, mobility data serves as a proxy for economic activities. (The researchers assert that population-level mobility data — for instance, transit and shopping trends — can show how people change their behaviors once distancing mandates are implemented.) A transfer learning scheme enables knowledge-sharing among regions to reflect the phases at which countries around the world (and cities in the U.S.) return to work.
The AI model performs day-ahead forecasts given smartphone mobility data, weather data and other variables. To address the challenges of limited data availability (since the start of the pandemic) and robustness to changes like relaxed self-quarantine measures, the researchers employed a multi-task learning framework comprising models co-trained for a set of prediction tasks with corresponding data sets. Together, these models learned the regional differences in electricity consumption and the effects of COVID-19 mitigation efforts, and they enabled knowledge transfer so that forecasts remained accurate even in the presence of unseen data for a particular location.
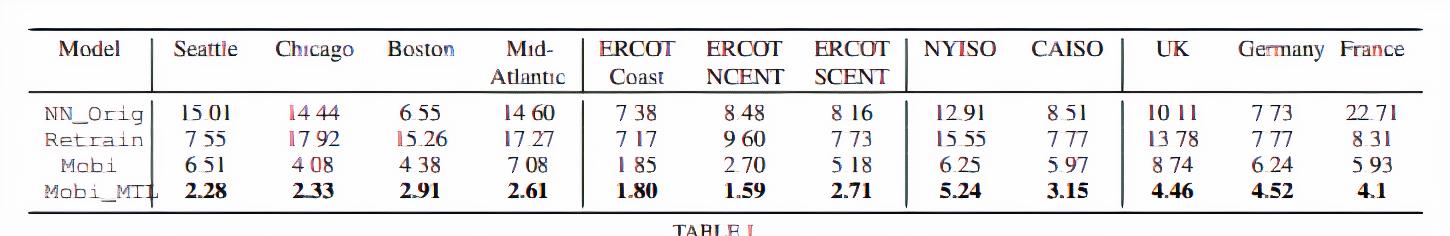
Above: Simulation results for day-ahead load forecasts.
To train the system, the researchers collected mobility information from Google’s and Apple’s anonymized COVID-19 community reports, in addition to publicly available hourly country-, zonal-, and metropolitan-level electricity consumption data. They combined them to create a corpus covering February 15 to May 15, which spanned pre- and post-lockdown periods in all areas of interest.
The researchers report that in simulation experiments, their best model improved over baselines that didn’t incorporate mobility data, particularly for U.S. metropolitan areas. For instance, in the Seattle City Light service region for the two weeks between May 2 to May 15, the baseline model had a day-ahead forecast error rate of 15.01% (much larger than the typical 2% to 4% before the pandemic) compared with the proposed model’s error rate of 2.28%. Indeed, the proposed model was 3.98 times more performant than the baselines across all benchmarks.
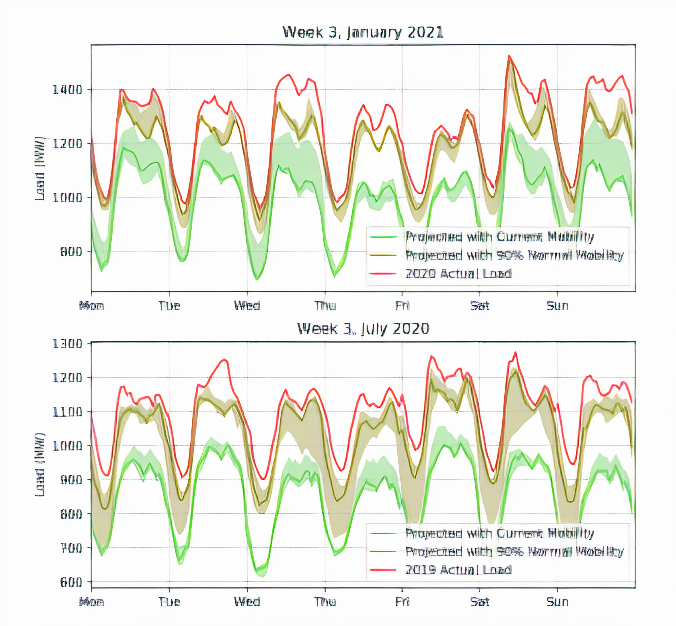
Above: Load projections for January 2021 and July 2020 based on Seattle weather profiles from the previous year, considering scenarios of mobility patterns.
In a separate experiment, the team used their model to plot out load curves far in advance of the start of the pandemic. After concatenating estimated mobility features along with weather data from weeks in July 2019 and January 2020, they calculated possible load scenarios in the Seattle area during July 2020 and January 2021 and found that the model’s output showed a relationship between reduced mobility and load. “We can see the decreases of mobility indexes poses more reductions of winter load, with a peak load reduction of over 300MW if current mobility patterns persist,” the coauthors wrote. “By explicitly incorporating mobility patterns, our approach can greatly reduce the error between forecasts and actual loads … As the global pandemic may still pose impacts to the power grids in the future, we think techniques developed in the paper could inform grid operators possible future load patterns.”
The team’s paper is currently under review at Nature Energy.
Story Adapted from Kyle Wiggers | VentureBeat